





For two financial years running, not a single one of Kenya’s 47 counties has earned an “A” grade for fiscal management. Not the wealthiest. Not the most industrious. Not even Nairobi, whose budget dwarfs that of any other county government in the country.
That is the headline finding buried inside the Parliamentary Budget Office’s new County Fiscal Performance Measurement Index (CFPMI), the first standardised, data-driven scorecard the Senate has ever had on how counties spend public money.
Built under Article 96 of the Constitution, which gives the Senate oversight of counties’ revenue, the index scores all 47 counties across seven indicators: budget implementation, development spending, own-source revenue collection, wage and benefits expenditure, pending bills, county assembly spending ceilings, and audit outcomes.
Composite scores run from 0 to 1, mapped onto a five-tier grading system from A to E. The numbers tell an uncomfortable story about the state of devolution thirteen years in.
The national average composite score increased from 0.469 in FY 2023/24 to 0.471 in FY 2024/25, a marginal improvement that the PBO itself describes as “modest.” The share of counties in the middle “C” band was roughly 74.5 per cent, according to our count of the report’s own ranking table. PBO’s executive summary cites 76.6 per cent.
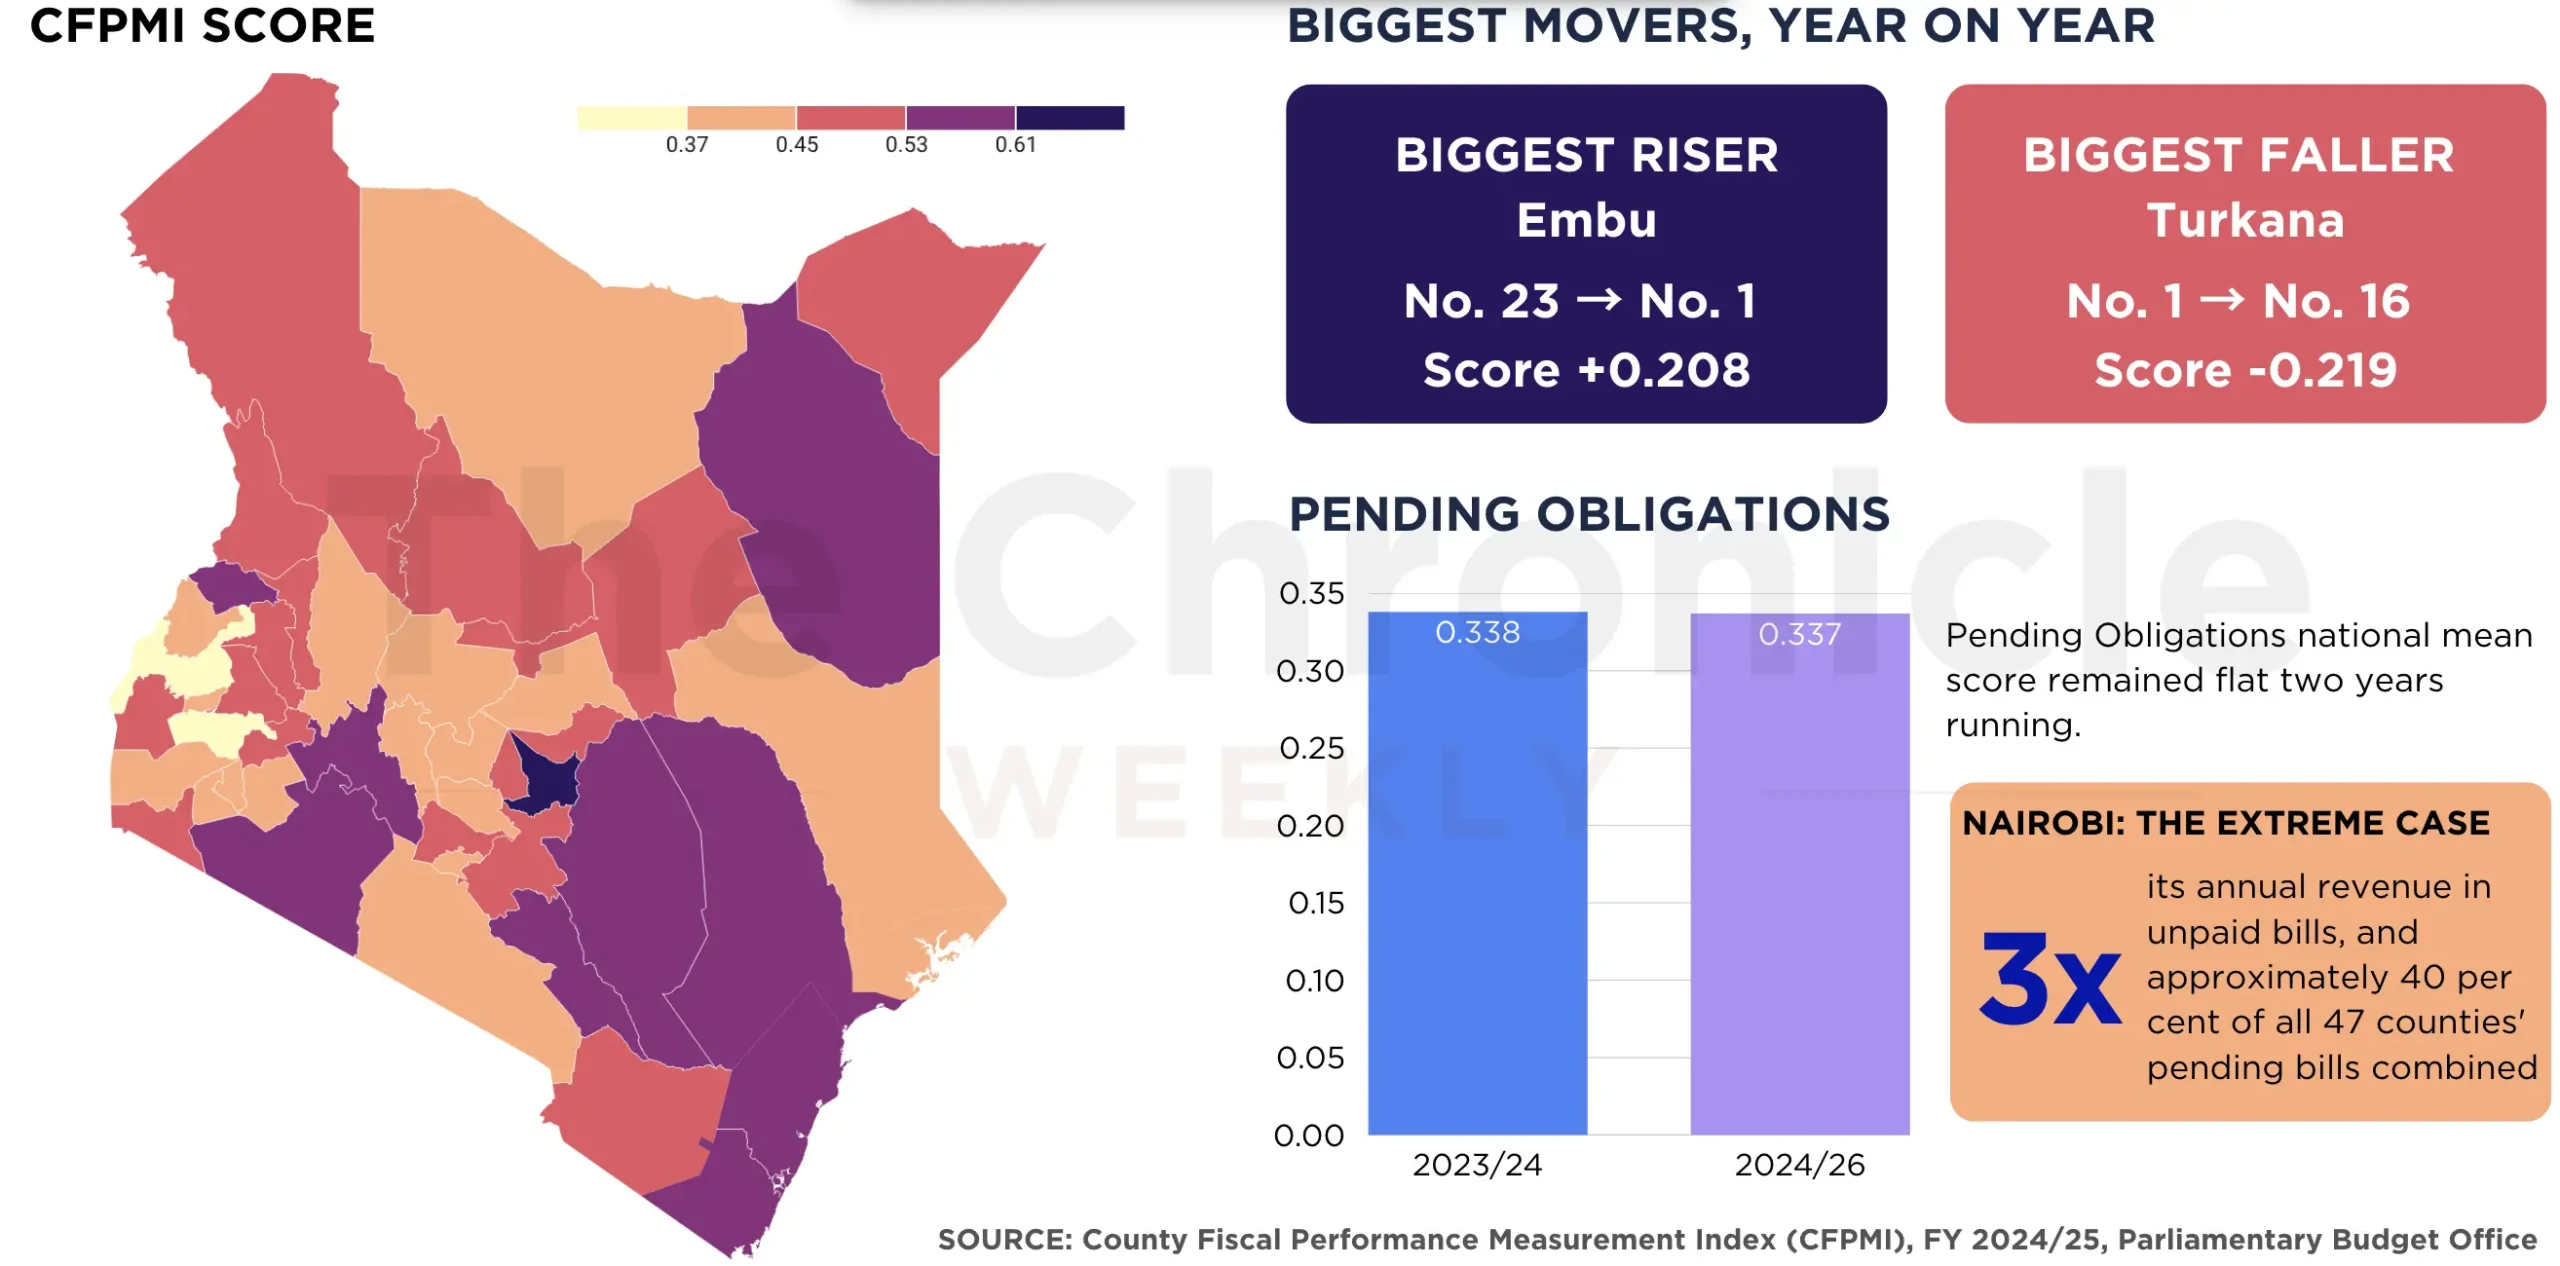
Either way, the picture is the same: the vast majority of counties sit in the middle of the pack, competent in places and failing in others, with only three – Embu, Narok and Wajir – clearing the bar into “B” territory in FY 2024/25. Embu’s leap from mid-table “C” to the top of the national ranking in a single year is the report’s one genuine good-news story.
Rich County, Failing Scorecard
Nairobi sits on the largest county budget in the country, yet it ranked dead last in FY 2023/24 (position 47, CFPMI 0.324) and only crept up to 43rd the following year, still firmly in the “D” band.
Wealth and administrative capacity, in other words, are no guarantee of fiscal discipline, a finding that cuts against the assumption that urban, high-revenue counties automatically outperform their poorer, rural counterparts.
The report describes Nairobi’s position as “the most extreme case of fiscal insolvency among all counties” with unpaid bills running to more than three times its total annual revenue. Nairobi alone accounts for roughly 40 per cent of the pending obligations owed across all 47 counties combined. Its score on this single indicator was effectively zero.
Nairobi is not alone in this failure; it is simply the most dramatic case of what is, nationally, the worst-performing indicator. The mean pending-obligations score between the two years stuck at 0.337–0.338.
Every other indicator showed at least some movement, up or down. Pending bills didn’t move, which PBO reads as evidence of a structural problem in procurement, commitment control and debt management rather than a one-off shock.
Bills Strangling Growth
Buried near the back of the report is a regression analysis that gives the pending-bills story real teeth.
Running county fiscal indicators against Gross County Product, PBO’s economists found that a 1 per cent increase in a county’s pending bills is associated with a statistically significant 0.043 per cent reduction in its economic output, the strongest and most consistent effect of any variable tested.
Effective own-source revenue collection and full budget implementation both showed smaller, positive, statistically significant effects on growth.
Development expenditure, by contrast, showed no statistically meaningful relationship with growth at all, even though 27 of 47 counties still fail to meet the constitutional threshold of allocating at least 30 per cent of their budget to development projects, and seven counties (including Nairobi) allocate less than 20 per cent.
PBO’s own reading is blunt: either the counties are underinvesting in development to begin with, or the money that is being spent on development isn’t translating into productive assets, a distinction the report says needs further scrutiny rather than being read as vindication of low development spending.
What The Scorecard is For
None of this is presented by PBO as a verdict on individual county leadership so much as a diagnosis of system-wide weakness.
Audit outcomes remain weak nationally (mean score 0.508, a small improvement); county assembly spending against Commission on Revenue Allocation ceilings actually worsened, from 0.655 to 0.611. Only one county, Tana River, hit a perfect own-source revenue score.
PBO’s headline recommendation is that the Senate use the CFPMI to direct its oversight, training scrutiny specifically on what it calls the “bottom nine”: Kisumu, Kakamega, Busia, Bomet, Nairobi City, Baringo, Lamu, Kajiado and Bungoma, the nine lowest-scoring counties overall in FY 2024/25.
It also wants the index published annually and formally folded into the national performance-monitoring framework, positioning it alongside international tools like the Open Budget Survey rather than as a one-off report.
Whether the Senate uses the tool that way is a separate question from whether the tool itself is sound, and an open one. As it stands, the CFPMI is the most granular, comparable evidence yet that Kenya’s county governments, collectively, are not meeting the basic fiscal responsibility standards set out in the PFM Act.
With the 2027 election cycle already reshaping political attention at the national level, a scorecard built specifically to hold county governments accountable is arriving at precisely the moment national politics is best positioned to drown it out.